The Trump Bull Market is NOT Over!
2017 has been a disappointing year for the kind of trader who thrives on volatility! The VIX has been stuck near historic lows, and ever since President Trump has been elected every dip in the market has been a bear trap. How much farther can it go?
How Old is the Bull?
I frequently see interviews where the talking heads on finance TV shows mention how the bull market has been going on for 8 years and is due to end soon. (Here's one such interview) There's a common thread of thought that a bull market typically lasts 5-7 years before a bear market. The media often considers any prolonged decline in the S&P500 of 20% or greater to be a "bear market", while a 10% decline is referred to as a "correction".
So how does the current bull market really compare to previous bull markets? I went back to S&P500 charts since 1993 noting all the major advances and declines from the market peak to the market bottom. Several long-lasting corrections such as the 2016 multiple-dip in the market in which the S&P 500 declined 15% I counted as a bear market.
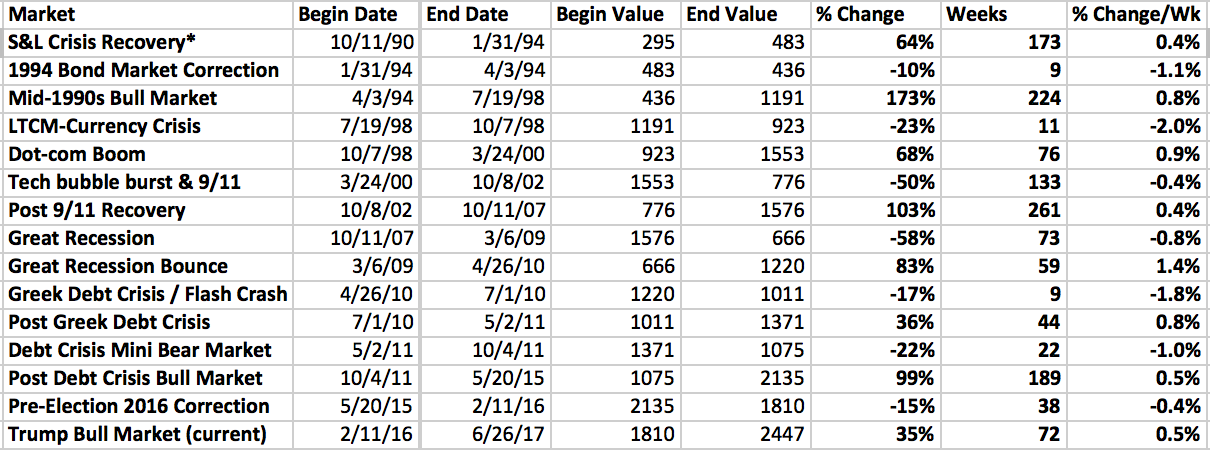
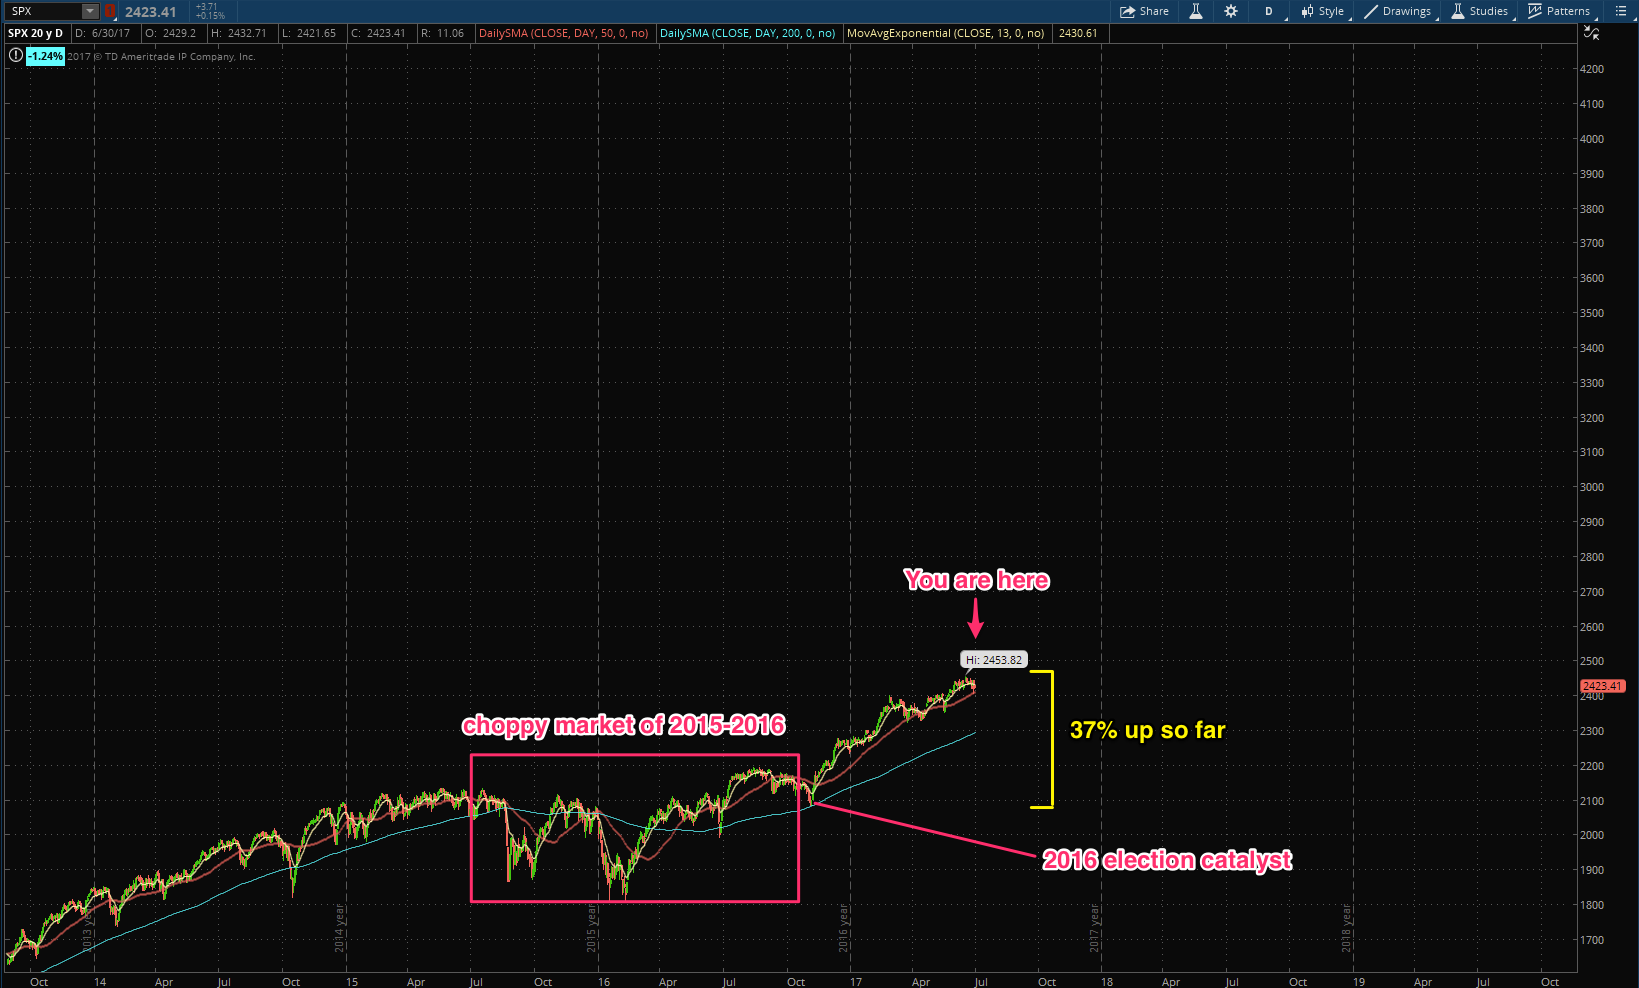
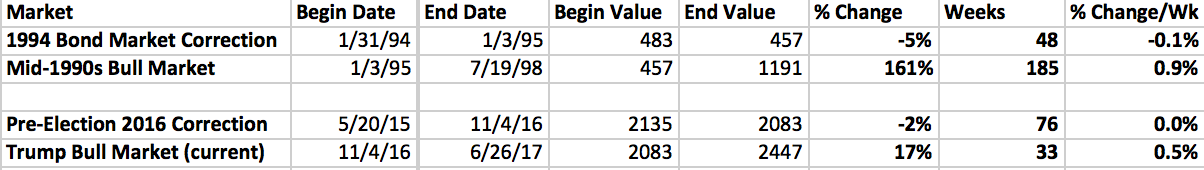
As you can see, the typical bull market lasts an average of 172 weeks and the S&P 500 average advance is between 36% and 173%, with the average gain of 89%. By this measure, the Trump bull market, which actually began with the S&P500 bottom of 1810 in February of 2016, is still fairly young at 72 weeks and up 35%.
But what if we stick with the strict definition of a bear market being a 20% decline? The Trump bull market still has room to run by historical standards.
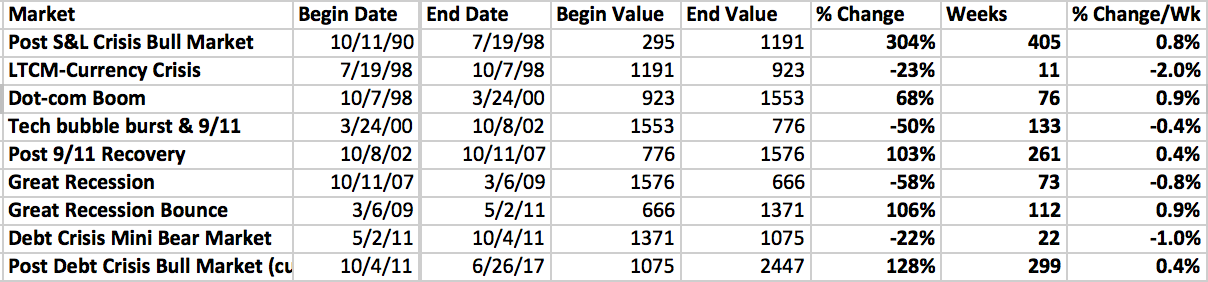
But using the strict 20% decline as a delimiter for bull/bear markets, the typical bull market is even more robust, lasting an average of 231 weeks and advancing between 68% and 304%, with the average gain of 142%. By this measure the current bull market is 299 weeks old and counting, with an advance of 128% in the S&P500 index. While still a long-lasting bull, it is by no means unusual and could still continue.
The 20% bear market definition also puts the current bull market's beginning back to the debt crisis of 2011. When people on the television say that the bull market began in 2009, they are conveniently forgetting the rough patch we hit in 2011 when the US Treasury debt was downgraded over Congress's debt ceiling debate. There were also many concerns at the time that economic growth was weak and that the economy would slip back into the Great Recession.
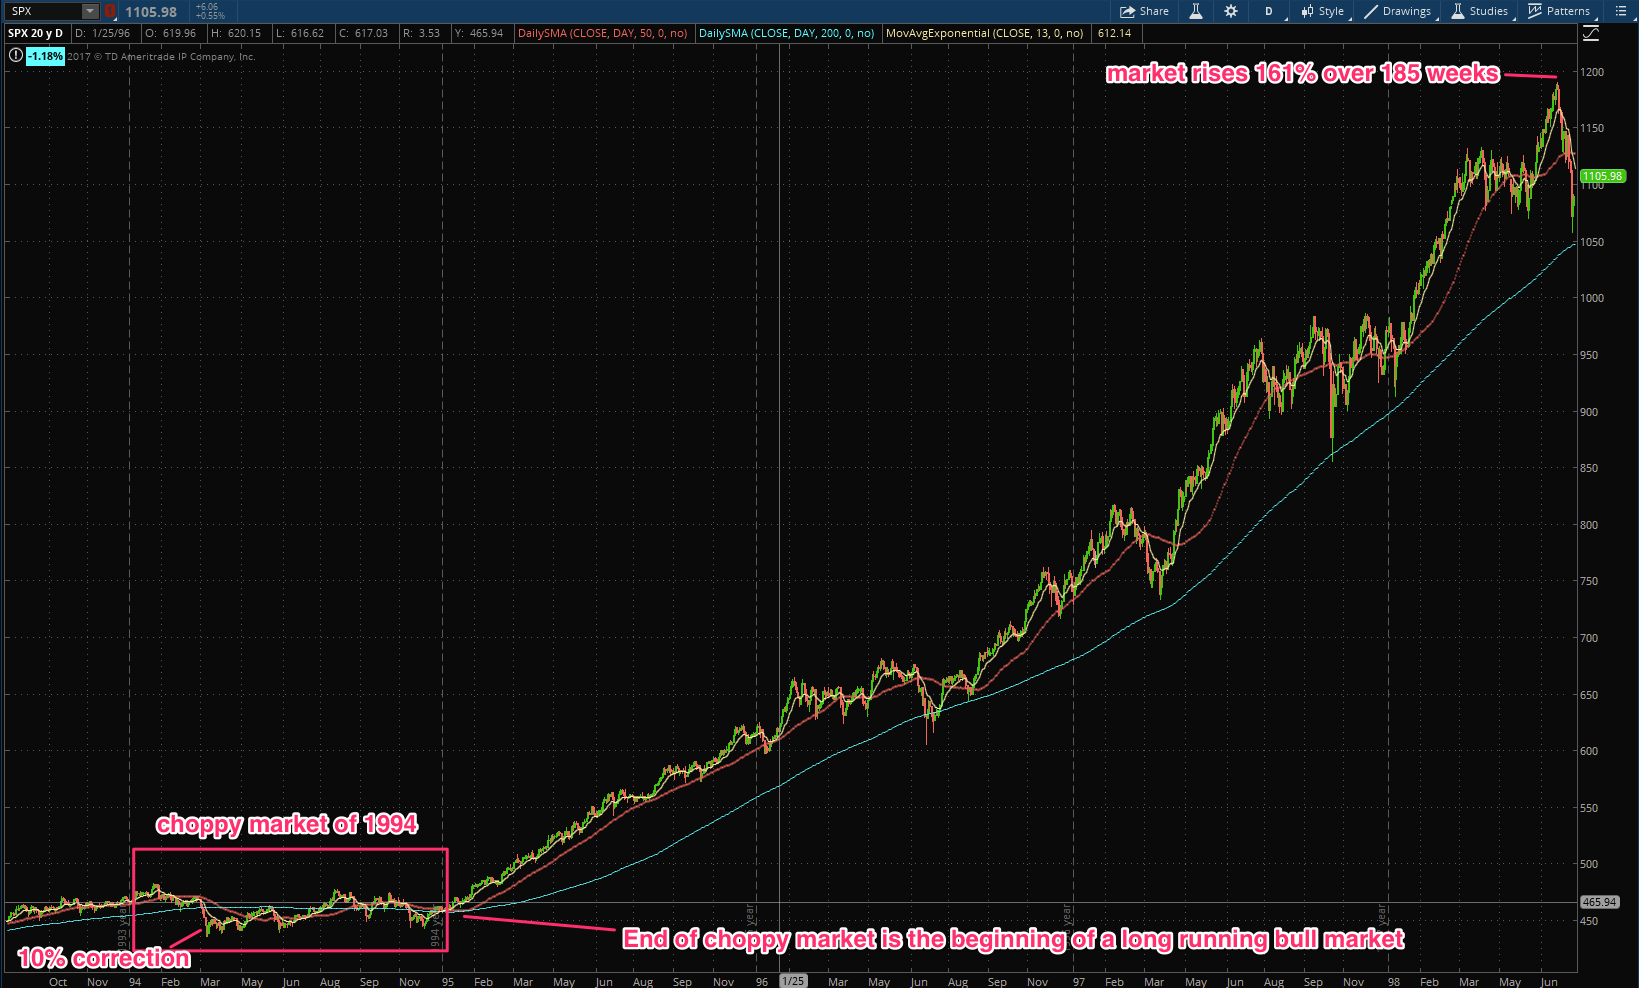
My opinion is that the market's choppy ride from August 2015 through February 2016, while not quite a bear market, was a healthy rotation of money that shook out all the weak hands and set up the building of a new bull market. Remember, the stock market has behaved quite differently ever since the 2016 election season ended - as if the election was a catalyst for the next big stock market move up. In historical context, I believe this action looks most similar to the 1994 choppy market where stock prices were stuck in a volatile range, then 1995 abruptly opened the start of one of the stock market's biggest bull market runs.
Is VIX Complacency a Concern?
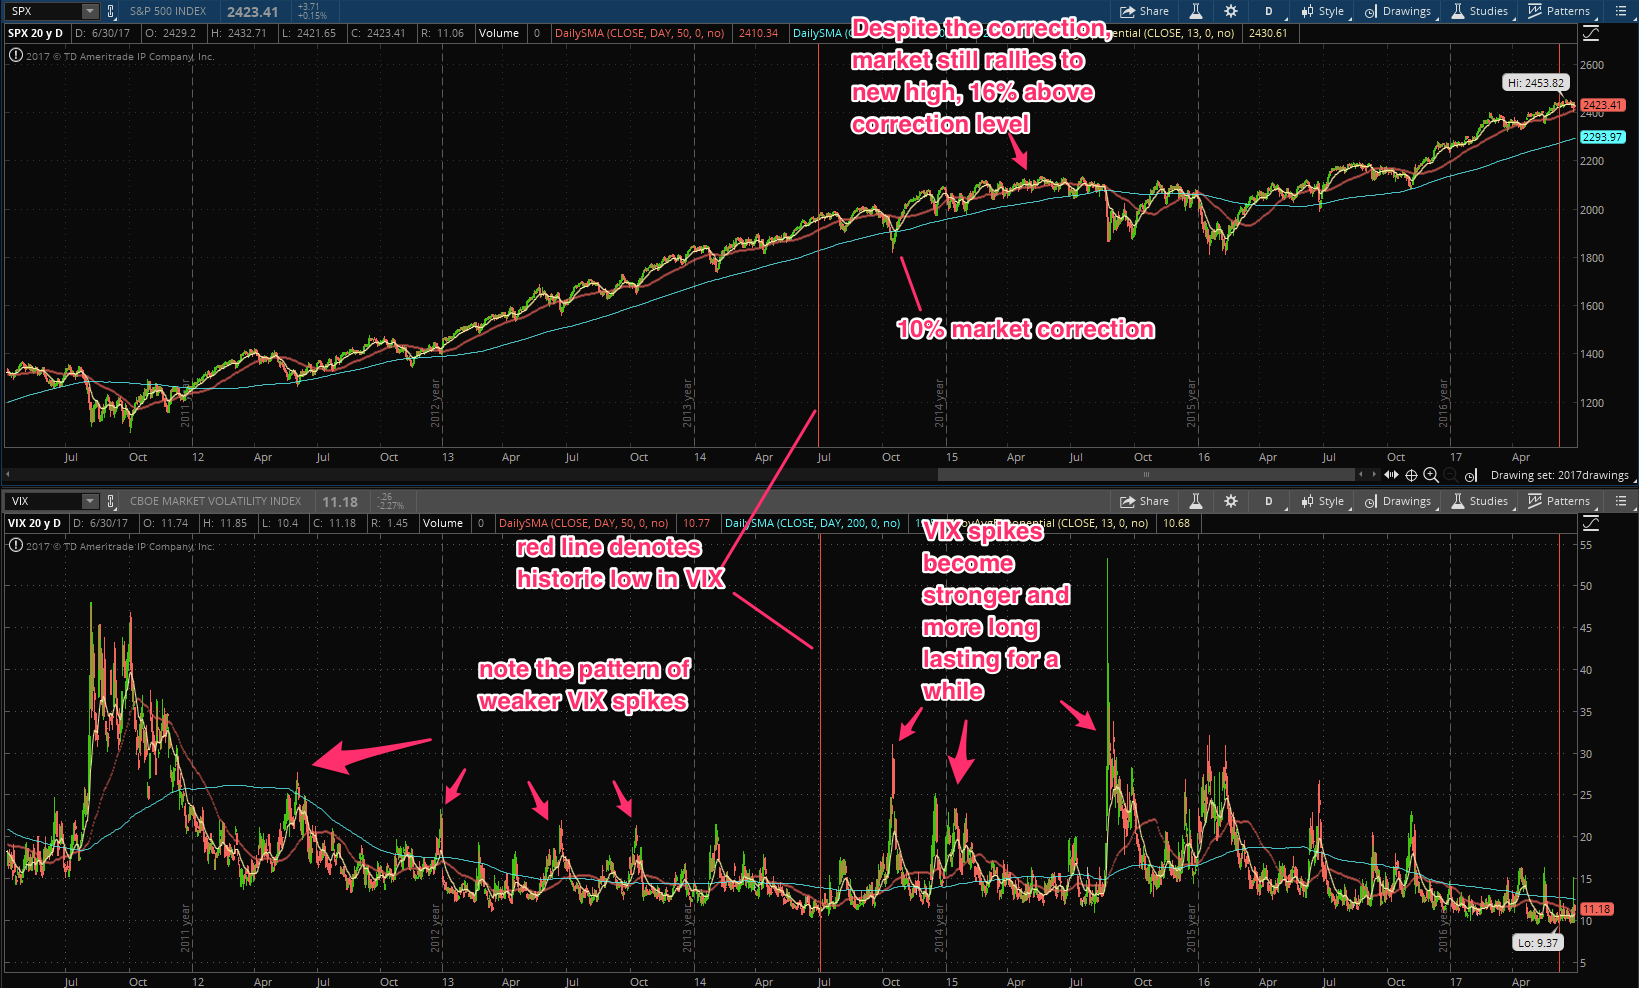
Something I find odd about about the current state of the market is the historically low VIX. It's hard to believe that a little over a year ago investors were spooked over Brexit and there seemed to be widespread fear. Now we are at a historical level of complacency. Might this signal the stock market as being too optimistic about the fundamentals?
The last time the VIX achieved a historic low as the summer of 2014. Not long after that we had a correction of 10% in the fall, but the market still rallied to new highs after that correction. Although, the correction following was a big one and the market choppy.
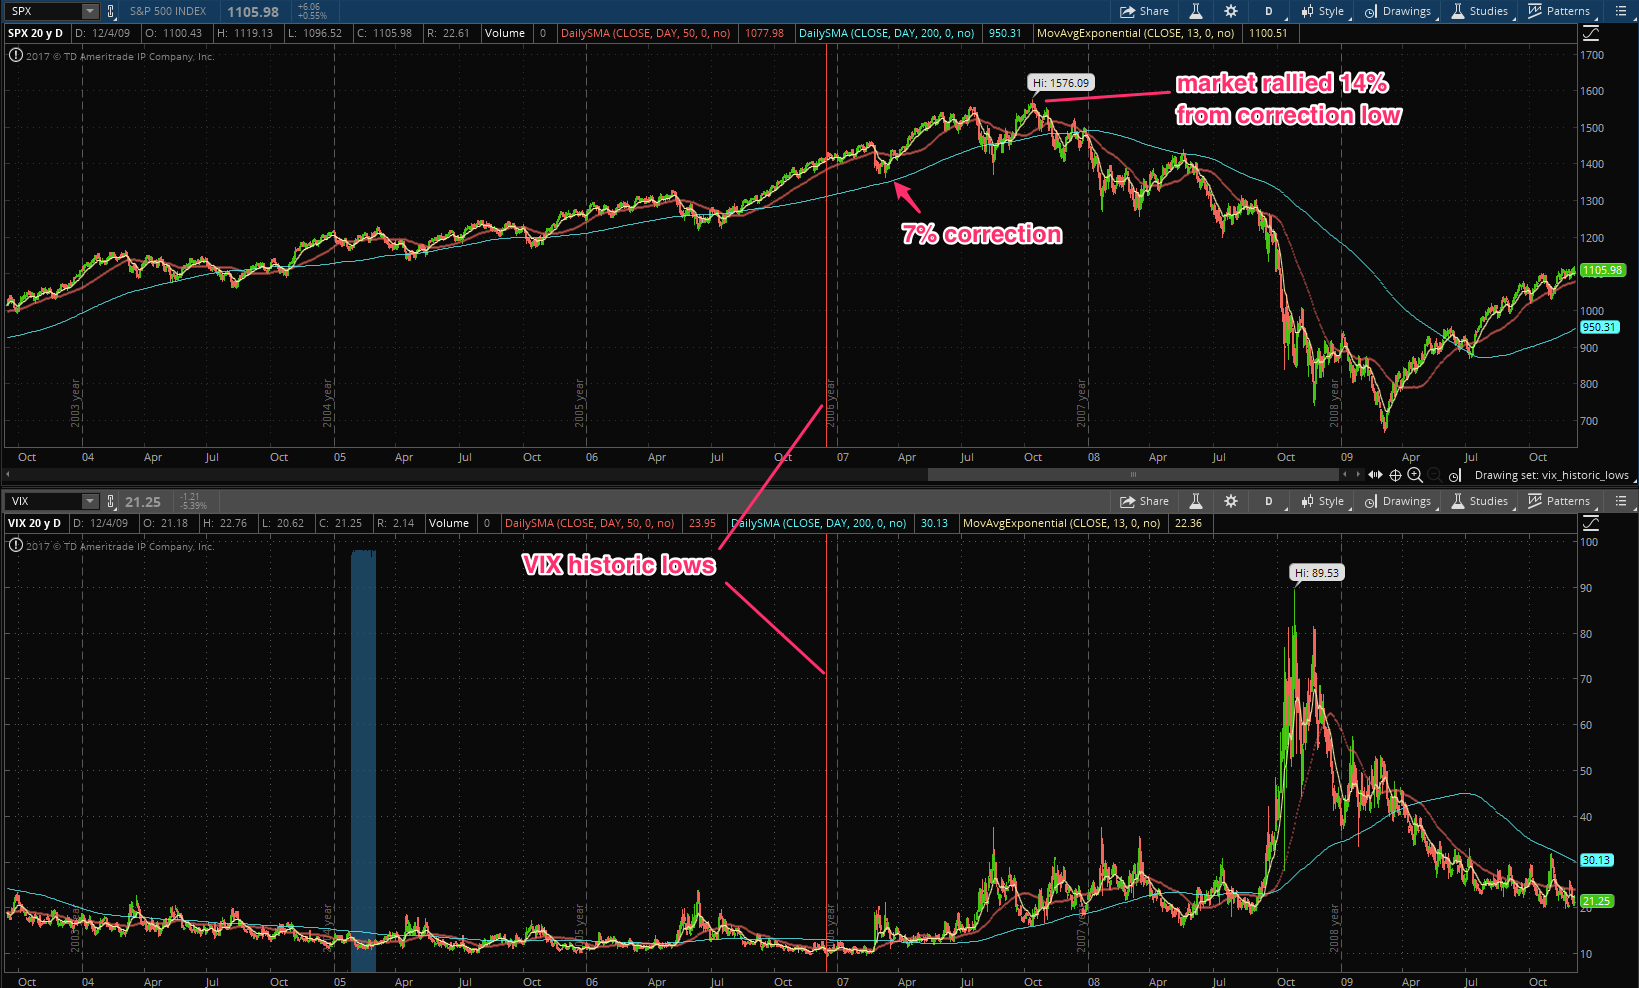
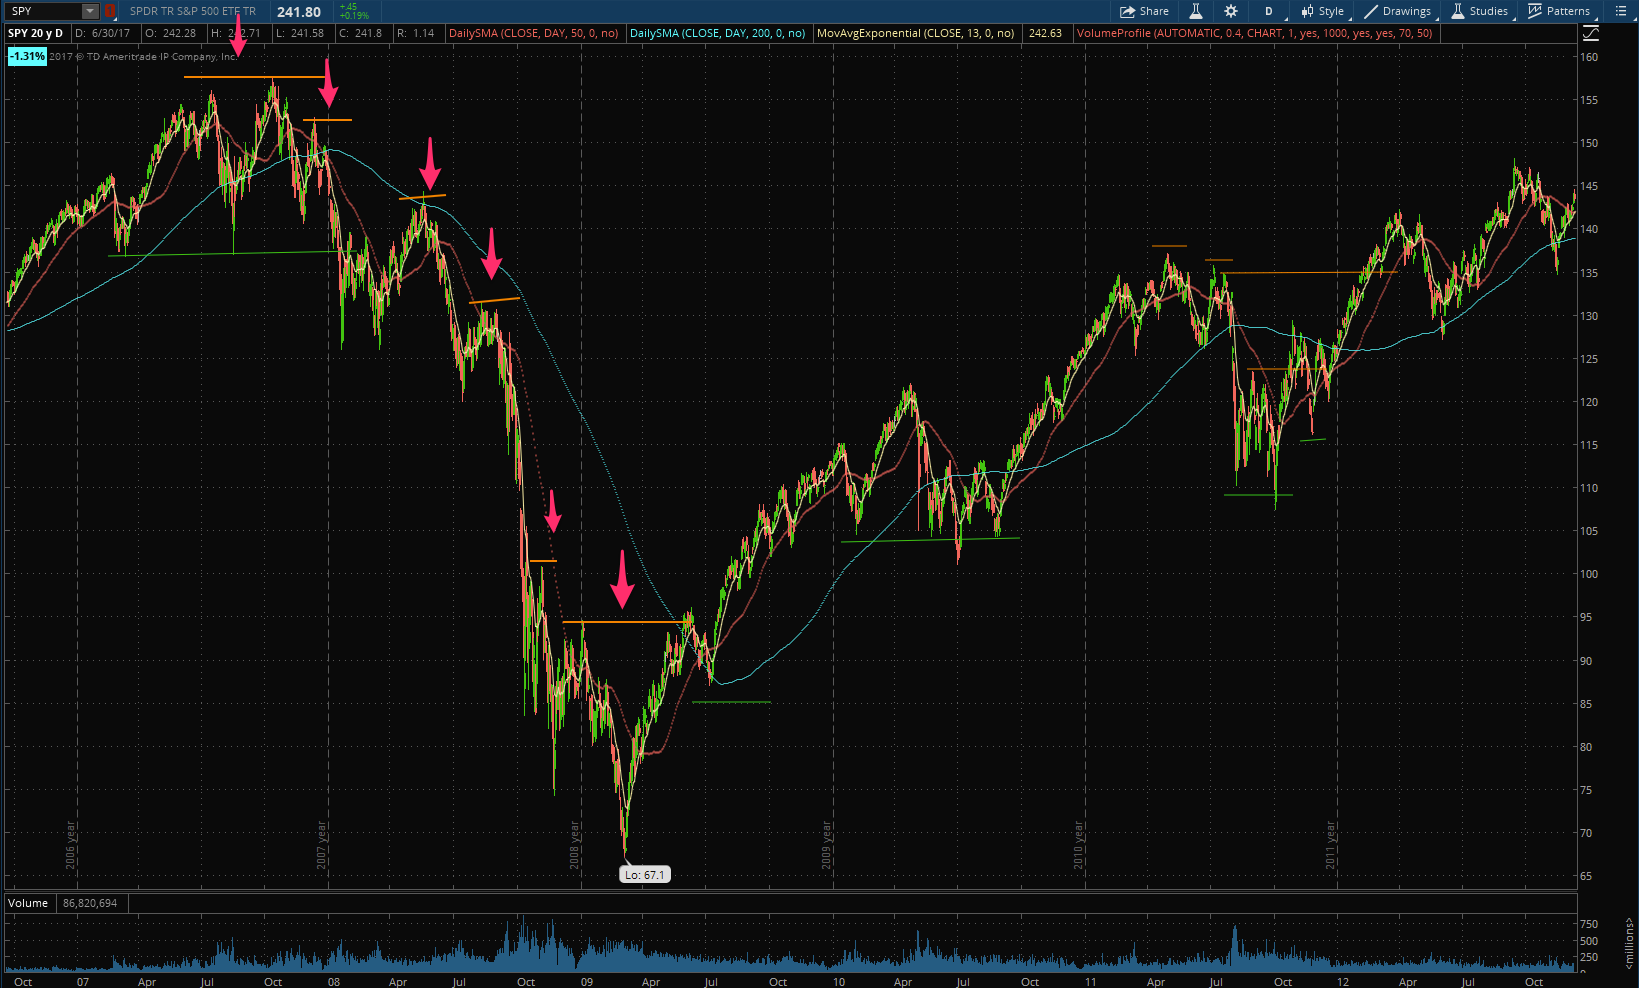
The time before that the VIX hit a historic low in the fall of 2006. Similar story… a correction followed not long after.
I'm not saying it's going to play out exactly the same way this time, but a historically low VIX does seem to mark the pendulum swinging too far into the territory of complacency. The good news is that it does not necessarily signal a top in the S&P500 and history seems to show that you have a good 12-18 months left in the bull market.
Could Complacency Set Up for a Bigger Crash?
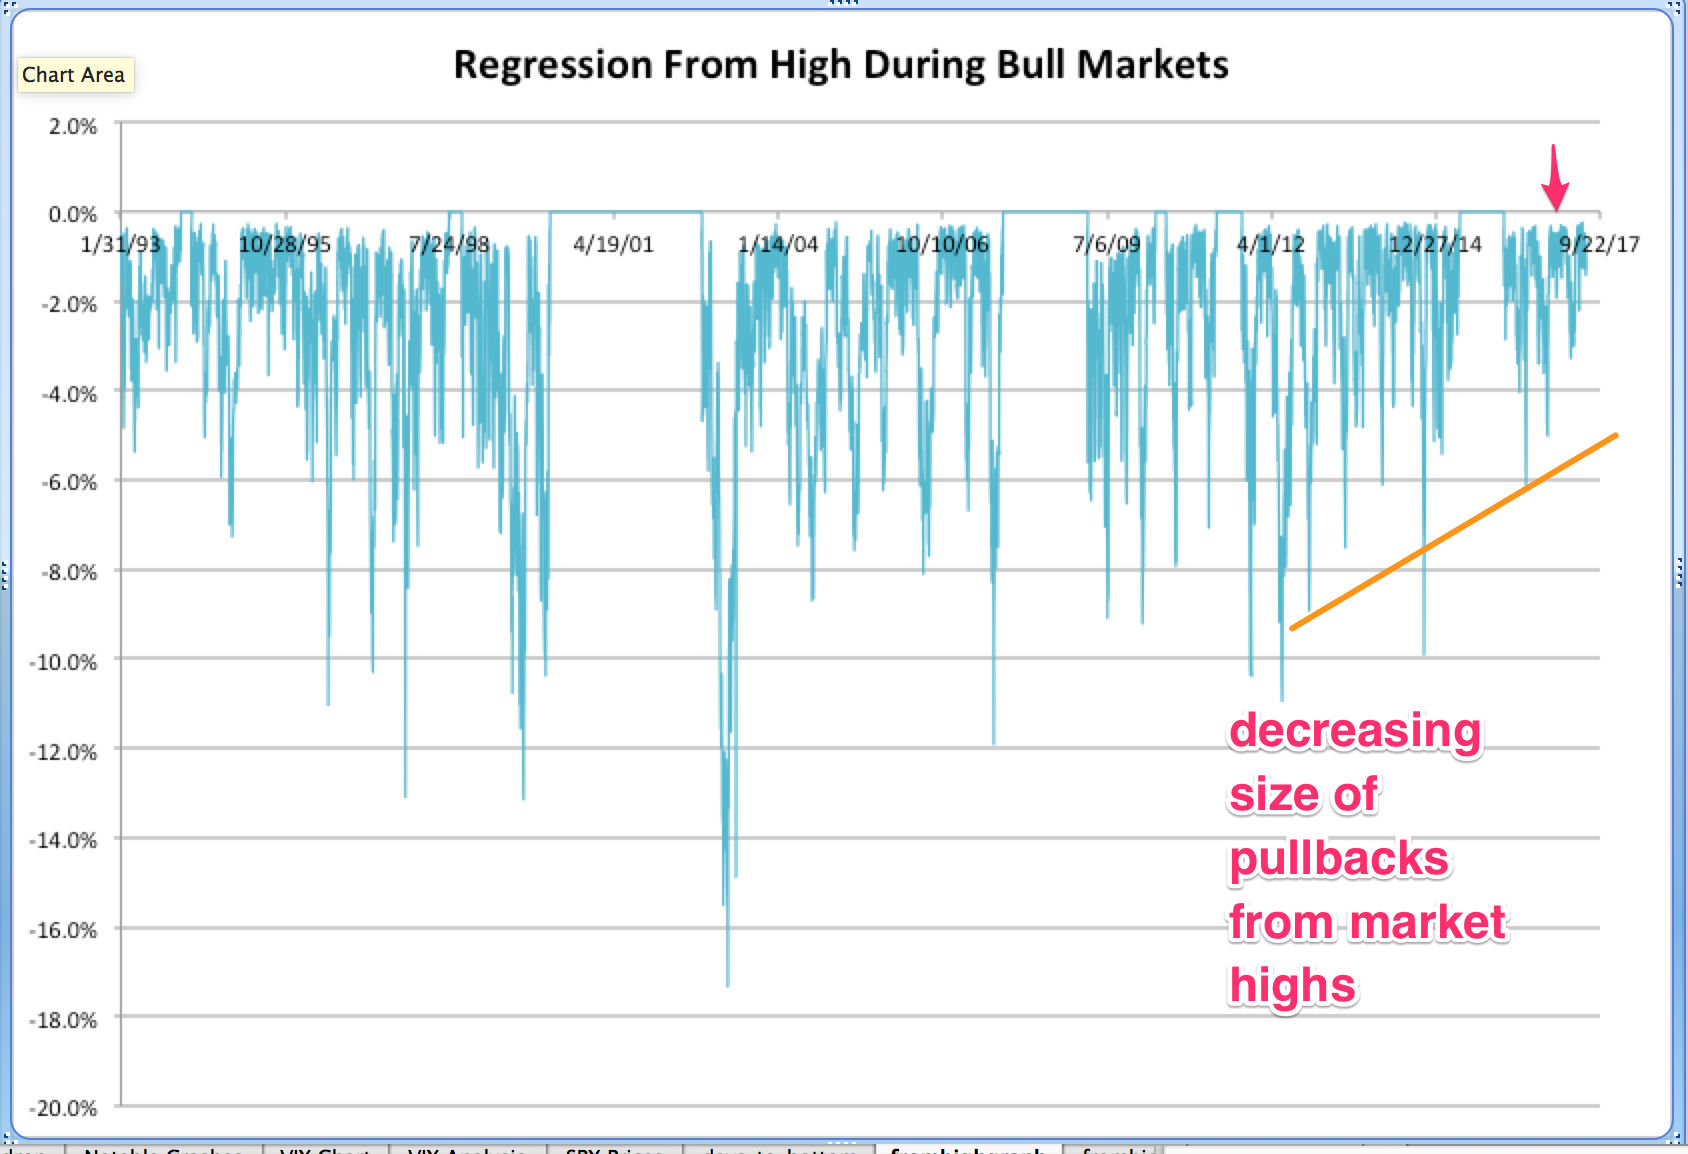
Since the 2016 election, the market hasn't even had as much as a regression of 4.0% from the new highs, which is unusual, and follows the trend of shrinking intensity of corrections from 2015. A correction of 6-10% seems due, and we may even see a reversal of this trend as we head into the next bear market and economic cycle.
If a bear market begins, it will happen gradually. The S&P500 will struggle to make new highs and we will see a widening of price swings.
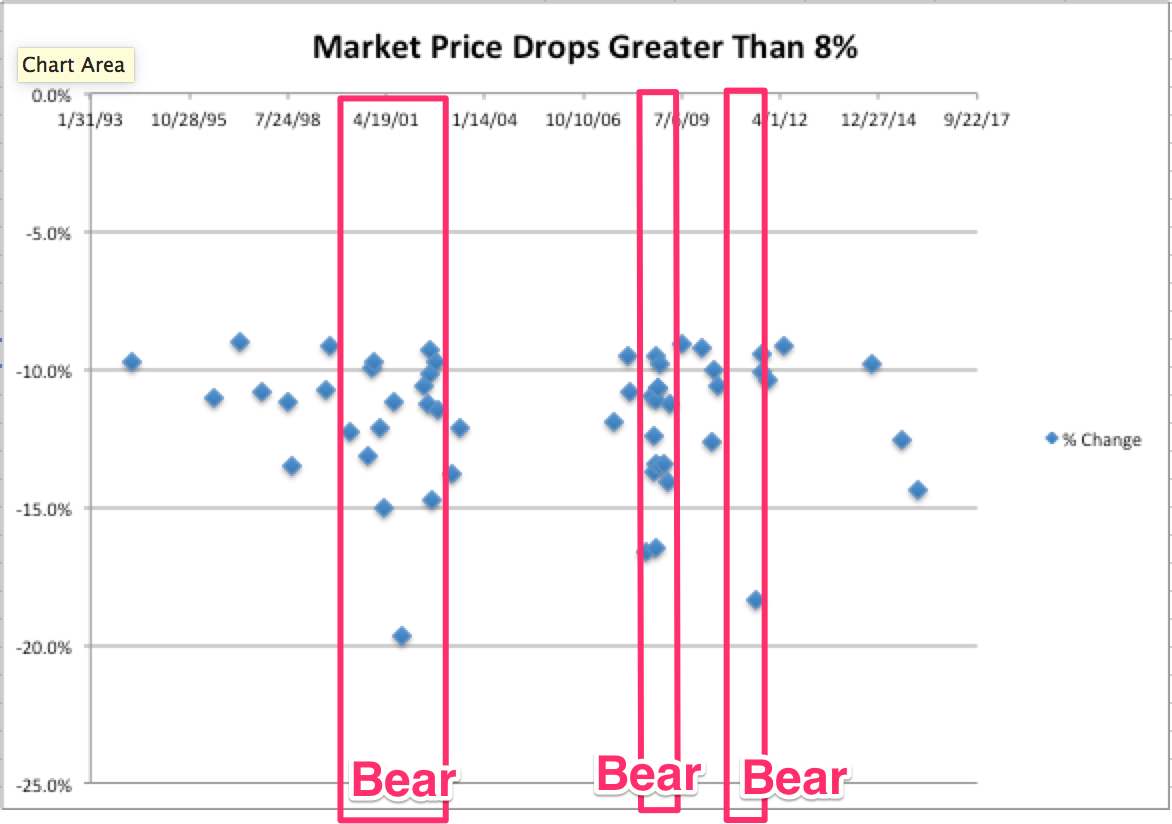
Previous Bear Markets last on average 60 weeks from peak to bottom, giving you plenty of time to get out early. The following chart shows that entering a bear market you have many large price fluctuations exceeding 8%. The market rarely drops 20% out of the blue without prior warning signs.
Summary
- Given the age and advance of the "Trump bull market" by various historical comparisons, there is still plenty of upside in the S&P500 over the next 12-18 months.
- The complacency signaled by the VIX may signal a correction of 7-12% occuring sometime later this year, but the bull market can resume shortly after.
- We are overdue for a pullback from the all time highs, given that the largest pullback from the highs since the 2016 was only 3.1%.
- A "bear market" (drop of over 20% from the S&P 500 highs) seems unlikely, and even if we were to enter a bear market there would be plenty of warning signs in the form of lower highs on the major indices.
The bottom line is that corporate earnings ultimately drive valuations and for now the fundamental outlook appears strong. There is no reason to think corporate growth will meaningfully shrink over the next 12 months. Industry professionals seem to remain optimistic about global and domestic growth. In Bob Doll's recent Weekly Commentary, he writes that second quarter US domestic growth could reach 3%, and expects corporate earnings to remain strong.