XIV is About to Get Dangerous
For a long time I have been an advocate of the long XIV trade, or effectively, to short any volatility spikes. This strategy has worked very well during the most recent bull market. Who wouldn't be lured by the tenfold gain seen on the XIV chart?

As always, past performance is not predictive of future returns. XIV has been smashed by this recent rout in the market, having fallen over 50% from its all time high. In fact, the XIV trade does not seem to be working well in general lately. It's price has had some wild swings since the fourth quarter of 2014.
What Happened to Contango?
As I explained in a post last year, XIV's returns have been supercharged by a prolonged period of backwardation on the CBOE VIX futures curve. Then early this year I wrote a follow up to that post when I noticed that XIV seemed to have broken its long term trend. I put forth several reasons that we may be entering a new phase of volatility where the persistence of contango helping the XIV may no longer be so reliable.
Since the stock market began its correction at the end of August, XIV has been hurting because the futures curve is stuck in backwardation. Unlike most volatility spikes in recent years, this time the VIX and backwardation are not fading so quickly. To better understand how this could impact XIV, I conducted a study of past "sticky" volatility spikes to determine if we could gain insight into the near future.
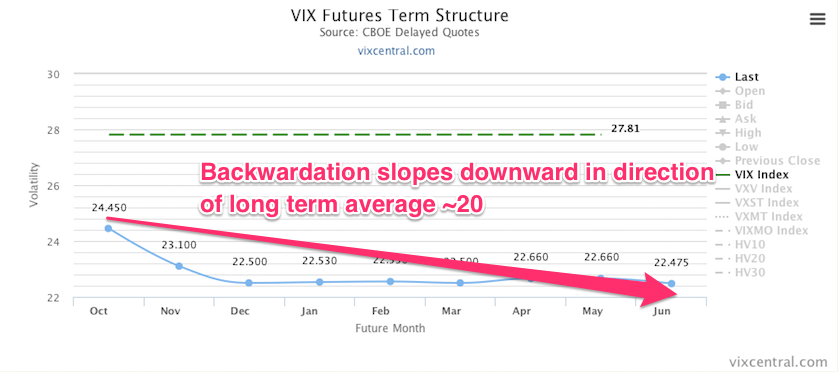
In this study, I make the assumption that any VIX spike above its long term average will send the VIX futures curve into backwardation. This will happen because the price of the nearest expiring futures contract is drawn to the spot price of the VIX, but longer dated futures contracts are drawn to the VIX long term average. The difference between the current VIX futures contract and the spot is what traders call the roll yield. This blog article by VIX Contango Oscillator explains it very well:
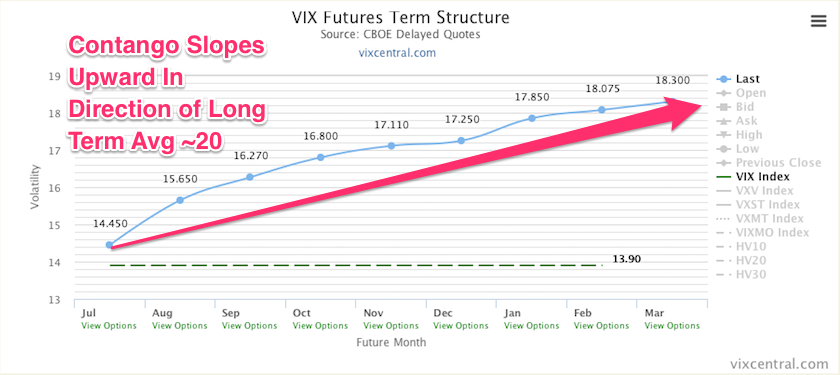
...a VIX Future contract over the long term tries to reach the average spot VIX value. The farther out in time the future, the closer the fair value will be to the average historical VIX value. The delta between the future price approximation and the average value goes exponentially closer to zero. The flipside of that calculation is that the nearest term VIX future has the largest difference to the long-term average, the second term VIX Future - the second largest difference, the third term VIX Future - the third largest difference, etc. The exponential decline in the delta can be plainly seen in the usual VIX Future Curve formation depicted above (Contango formation).
I downloaded the historical spot VIX prices from the CBOE website. Using data from 2004-2015, I calculated the average value based upon the daily closes to be 19.4. Next, I wanted to determine how often and the length of intervals that the VIX spends above its long term average.
My theory is that when the VIX is above the long term average, the short term VIX futures is more likely to be in a state of backwardation. Backwardation is harmful to XIV. Therefore, prolonged periods of time when the VIX remains above 19.4 should be very detrimental to the price of XIV.
Study Findings
From 2004-2015, I learned that the VIX spent roughly 1/3 of its time above the long term average. The median of 16.4 indicates that the distribution of where the VIX spends its time is skewed upward. In other words, a fewer number of high VIX days during spikes has pulled the average higher. This would explain how the VIX futures could spend more days in contango than backwardation.

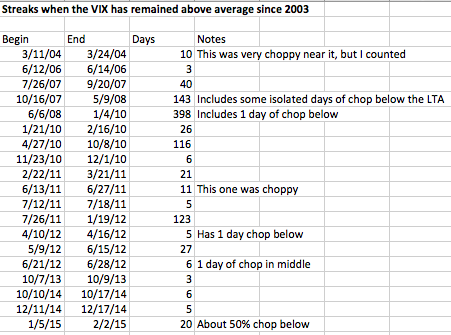
The longevity and distribution of VIX spikes is most interesting. I noted the length of periods when the VIX went above its long term average and held for a number of days. As expected, tumultuous times in the market correlated to longer periods of an elevated VIX. Here are key periods of time when the VIX went above its long term average of 19.4 and held. (I only analyzed whether the VIX was above or below 19.4; point value of much was not examined.)
I then grouped each period of high volatility into year and quarter.
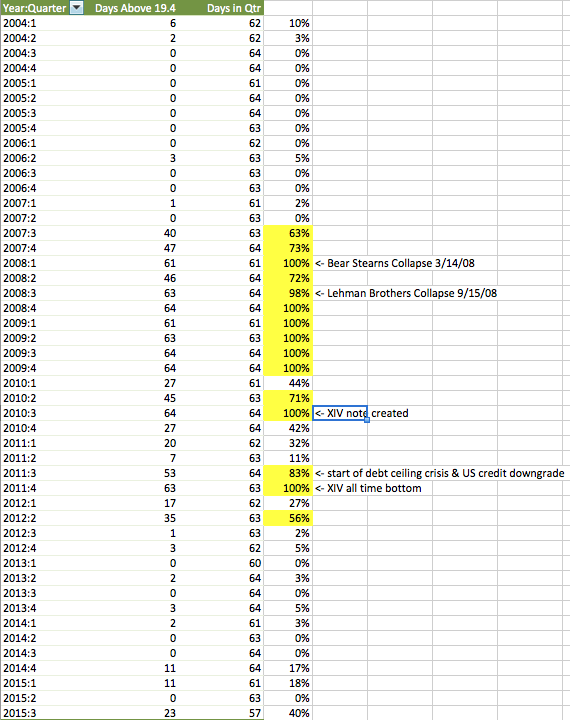
This table shows that the VIX is polarizing! During tumultuous times the VIX could remain elevated for extensive periods, which is very bad for XIV. In 2009, the VIX stayed above its long term average for the entire year. But during periods when the markets are relatively calm such as 2004-2006, the VIX won't spend more than a few days at a time above its long term average.
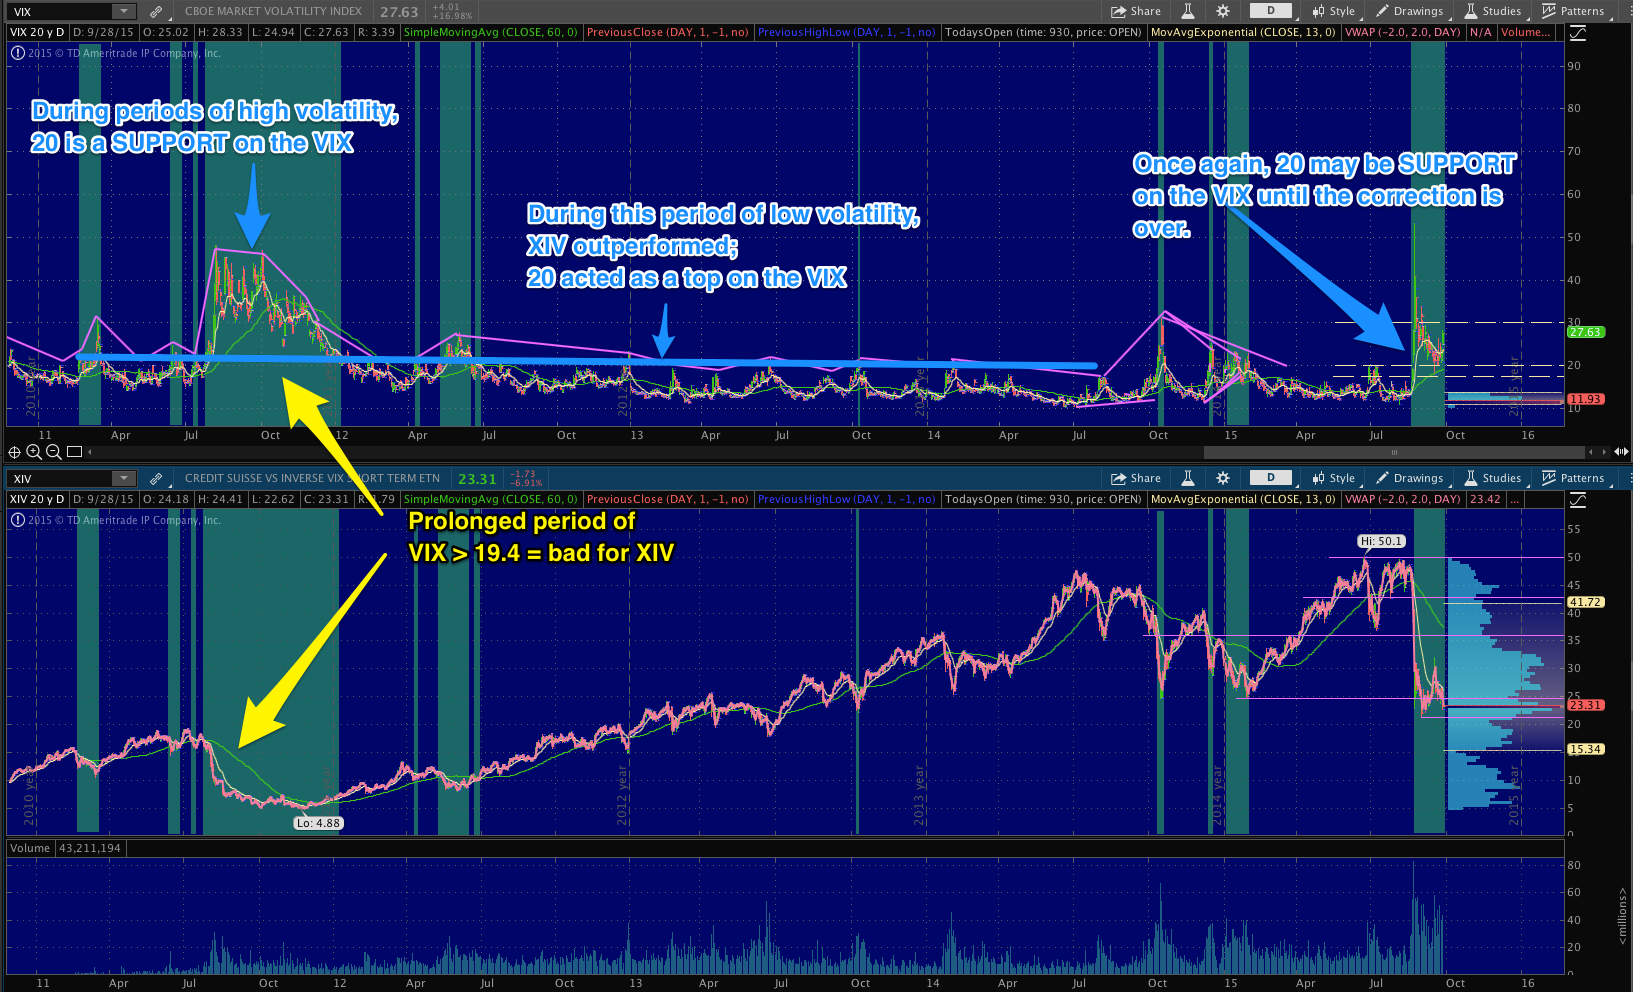
XIV was launched just before a period of historically low volatility. This has given the dangerous illusion that XIV is invulnerable and will always be driven higher by contango, which is not always the case. The only time we've really gotten a taste of how prolonged volatility affects XIV is 2011 when it took a 75% drawdown during the debt ceiling crisis.
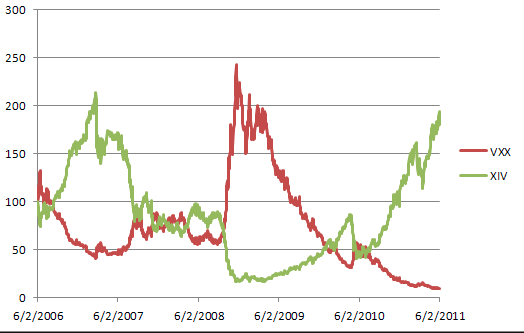
It is possible to use the SPVXSP index to backtrack the theoretical performance of the XIV before it was created, as described on this other blog. If only more traders had this view of the XIV during the 2008 financial crisis, perhaps it would be less appealing. As the author states, if you model the performance of XIV back to 2006, you will see that it would have lost 80% of its value at some point.
Where can XIV go from here?
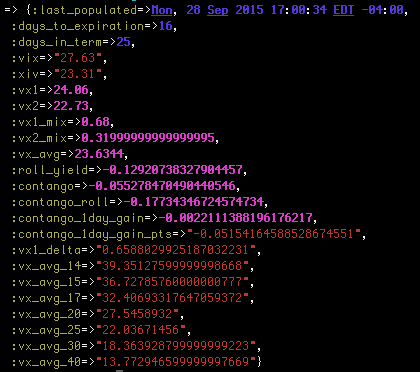
I use a proprietary model to estimate potential future prices for XIV based on percentage changes in the underlying VIX futures prices (months 1 and 2). As of today, my model indicates that the current effective price for the XIV's underlying VIX futures is 23.63. If in one day the VIX futures months 1 and 2 mix were to move to an average of 30, we could see XIV dip into the upper teens. The good news is that if volatility were to somehow go away and drop back to ~14, we could see XIV rally into the upper 30s.
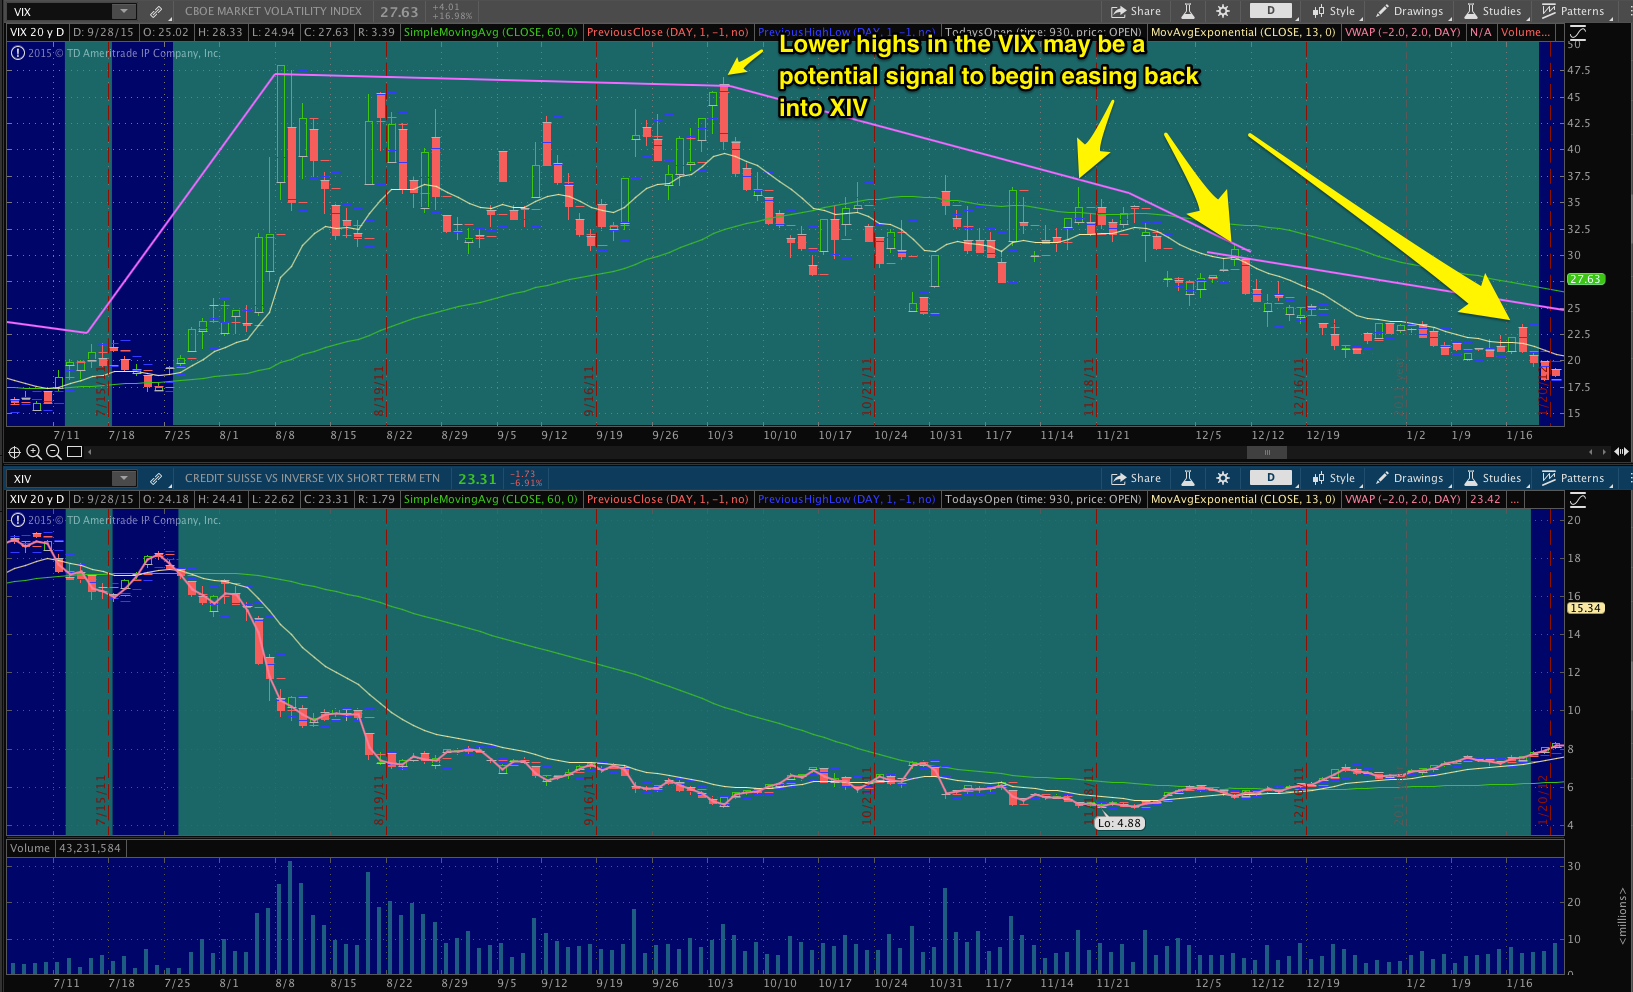
However, as we can see from the charts above, "sticky" backwardation can happen when the VIX finds support above its long term average, causing XIV to get hammered. I see this scenario as likely until near end of the year at best.
How I'm Trading This

The quickness and severity of the current VIX spike caught me by surprise. I was sitting on a small position from the upper 40's. When it gapped down and settled into the 20s I began building a more serious position. My plan was to add the rest of my intended shares upon any sign that the VIX was receding as usual, but that didn't happen yet. In fact, I made a mistake by buying into the fakeout rally following the most recent FOMC meeting, hurting my average.
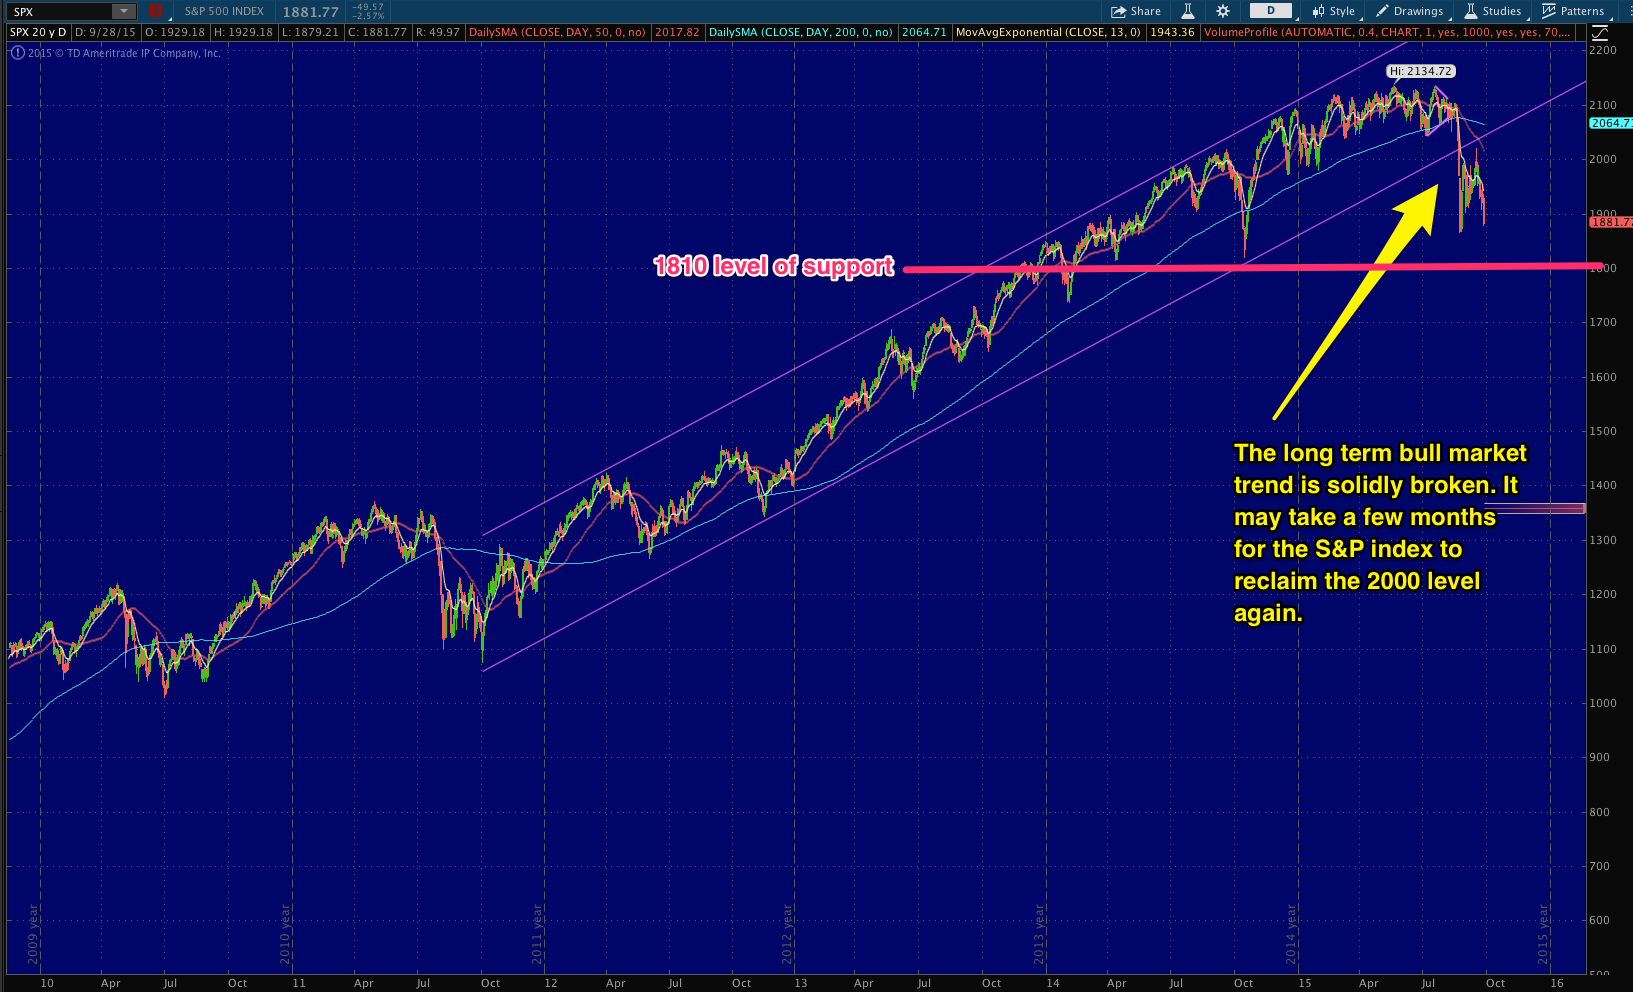
My research now tells me that since we are nearing 30 days with the VIX holding steady in the 20s, we may be in for a much longer volatility ride. This will not bode well for XIV. Until the S&P 500 reclaims the 2000 level, the VIX retreats back into the teens, and/or the VIX fades below the 200DMA, I do not think XIV is going to generate stellar positive returns. Judging by the length of past market corrections, I would venture to guess that the VIX can remain elevated for another quarter or more. Therefore, I will be reducing my size into rallies and looking to buy back at a better cost average.
One of my personal weaknesses as a trader is that I am often too early in acting on an idea. Executing too early will get you a bad entry. With my buying power tied up through premature trades, I will not be able to buy more shares unless I unload some. I certainly don't want to be heavy handed in XIV if the S&P500 falls to its next level of support at 1810.
Final Word
XIV inverse volatility is a compelling instrument. It's extreme performance over the last several years has caught the attention of many traders. However, the recent changes in the patterns of the VIX lead me to believe we are entering a new period of increased volatility, which would be harmful to XIV as a long term holding. Use caution when building a position as long as the VIX is supported above its long term average of ~20.