Four Tricks to Be More Confident in Using Stop Losses
This is the third part in a series about using stops effectively. In the last part, How to Stop Second Guessing Your Exit Plan and Start Trading, I identified some of the faulty emotional arguments that a trader may use to violate his predetermined risk management rules. In this blog post, I'm going to present four practices which may help manage risk more effectively.
1. Scale out of the trade, gradually reducing risk
If it feels disappointing to stop out on a trade, then don't stop out all at once. Adjust your size so that you can have two stop out points. You can set half of your shares to stop out at the nearest level of support, and stop out the rest if it hits the next level of support. This at least gives your trade greater flexibility to work and recoup your loss on the first stop while reducing your risk when it starts to behave contrary to your original expectation.
2. Horizontal lines make better stops than trendlines or moving averages
In my experience, using a horizontal "line in the sand" as a stop out point works much better than other chart lines such as trendlines or moving averages. I like horizontal lines because they are simpler to understand. Once a horizontal line of support is transcended, it becomes the new resistance level. The opposite happens for lines of resistance, which become lines of support once crosses.
I think horizontal lines of support/resistance are more effective because more people view a stock chart using specific price levels as pivot points. With trendlines or moving averages, there are a million ways to draw them that are slightly different, so its harder to treat them without some subjectivity. Consider the following two charts.
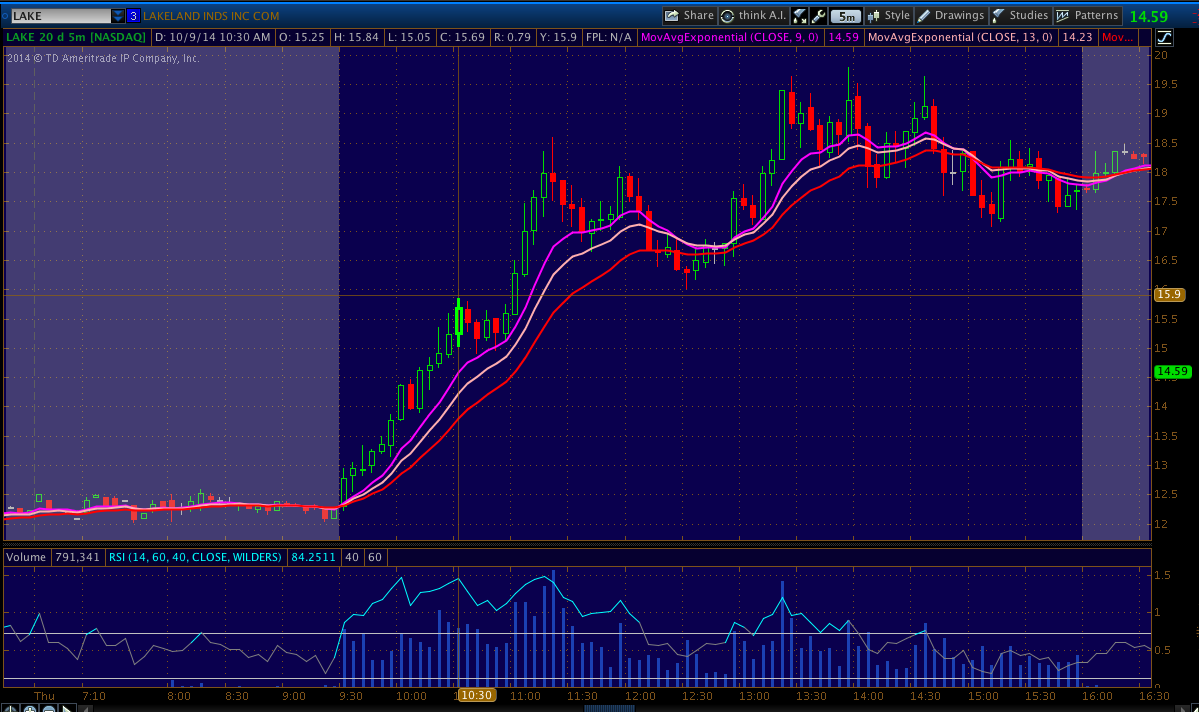
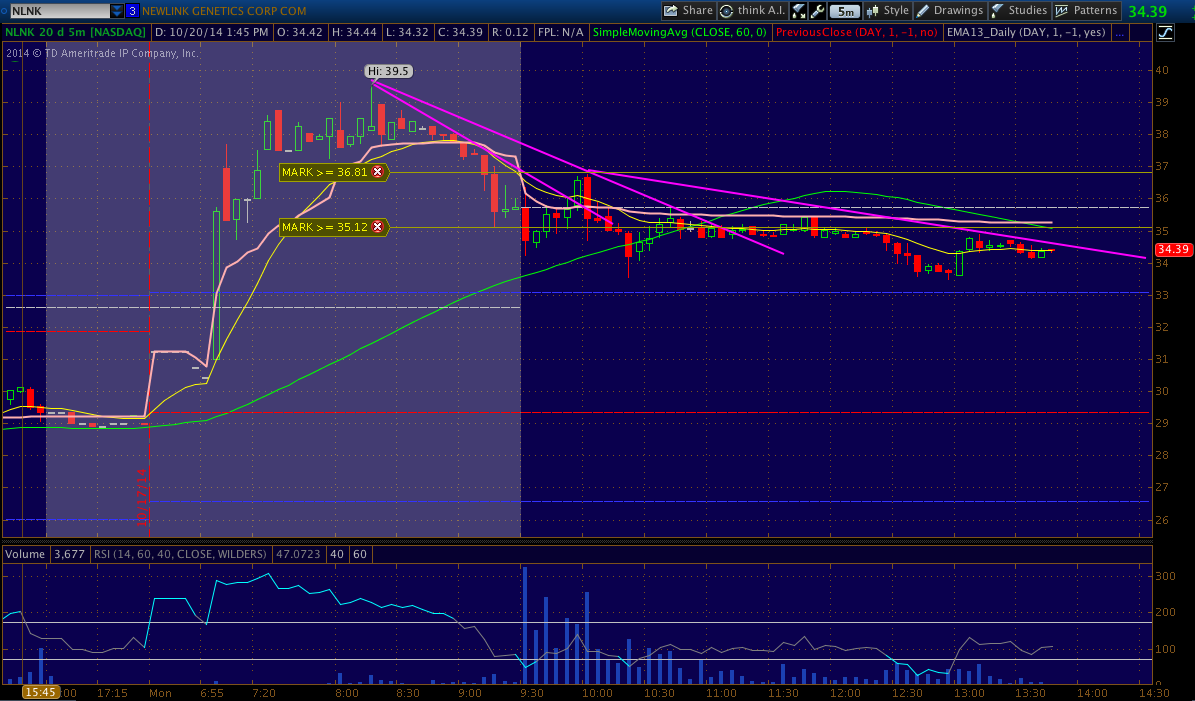
When it comes to setting stops, I like to use trendlines and moving averages to help me determine where to scale out of a winning trade. But when I'm starting into a new position I think using a horizontal support/resistance line is the most solid.
3. If you hit your stops too frequently, use a journal or analytics tool to find the underlying cause
If your confidence in using stops is rattled because you stop out of trades too frequently, then maybe the problem is not the stops but the way you are identifying setups. At the end of each day, write a journal with some notes on what trades you took, the setups you saw, and your emotional state in taking the trade. A tool like TraderVue or Profit.ly is excellent for drilling into your trades to determine what's working for you what what's not.
If you are like most traders and 50% of your trades turn a profit, then the probability of you having multiple stop losses in a row should look like this:
| Number of Stops Hit in Sequence | Probability of This Occurring |
|---|---|
| 1 | 50% |
| 2 | 25% |
| 3 | 12.5% |
| 4 | 6.25% |
If you find yourself stopping out too often, you may need to step back and reexamine your trades. You may be reverting to bad habits, or the market conditions may have changed without you realizing.
4. Raise your stops if the trade runs in your favor
Finally, a technique which has worked consistently for me in managing risk is to take 1/2 or 1/4 profits on a successful trade and then raise my stop to breakeven. This allows you to take profits on a trade which moves in your favor but allows you to ride the rest of your shares for as long as possible, maximizing profit. By moving your stop to your entry price, you make the rest of the trade essentially risk free.
